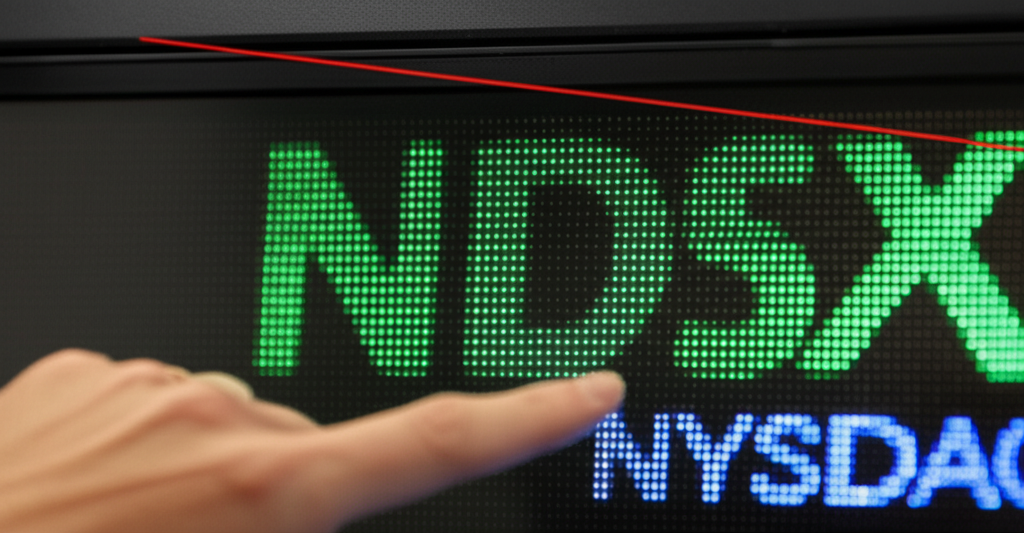
Nasdaq 100 Index Nears All-Time High but Remains Below Broken Trendline
The technology-heavy Nasdaq 100 index has been the subject of considerable discussion among investors, reaching tantalizingly close to its historical all-time high. This proximity to a new peak signals a robust recovery for many of the world’s leading technology and growth companies, fueling optimism across financial markets. However, a deeper look reveals a nuanced picture: despite its impressive ascent, the index still finds itself trading beneath a significant broken trendline, a technical detail that introduces a layer of caution for market observers.
The Nasdaq 100, home to giants like Apple, Microsoft, Amazon, and Alphabet, has been a central barometer for investor sentiment regarding innovation and future growth prospects. Its recent rally has been nothing short of remarkable, largely propelled by several key factors. Dominating the narrative is the pervasive enthusiasm surrounding artificial intelligence (AI), which has translated into surging valuations for companies at the forefront of AI development and infrastructure. Chipmakers, software developers, and cloud service providers have seen unprecedented demand, boosting their financial performance and investor confidence. Beyond AI, expectations of potential interest rate cuts by the Federal Reserve later in the year have also provided a tailwind. Lower borrowing costs typically make future earnings more attractive, particularly for growth-oriented companies that rely on accessible capital for expansion. Strong corporate earnings reports from several index constituents further validate the underlying health and resilience of these tech behemoths, painting a picture of fundamental strength that supports the market’s upward trajectory. This combination of technological innovation, macroeconomic shifts, and solid corporate performance has created a powerful momentum, drawing investors back into the tech sector with renewed vigour, often accompanied by a sense of “fear of missing out” (FOMO) as the index marches closer to uncharted territory.
Yet, as the adage goes, “the devil is in the details,” and for the Nasdaq 100, that detail lies in its technical position relative to a “broken trendline.” In the realm of technical analysis, a trendline is a visual representation connecting significant price points on a chart, indicating the prevailing direction of an asset’s price movement. An *upward* trendline signifies a bullish trajectory, acting as a dynamic support level. When such an upward trendline is decisively “broken” (i.e., the price falls below it), it often signals a potential shift in momentum, a weakening of the prior uptrend, or the start of a corrective phase. The current situation suggests that the Nasdaq 100 had previously established a strong upward trend, which was subsequently breached during a period of correction or consolidation. What market technicians are now observing is the index approaching this *former* support line from below. In technical analysis, a broken support level often transforms into a resistance level – a price point where selling pressure might increase, potentially hindering further upward movement. For the Nasdaq 100, this means that while the headline number looks strong, the index is encountering a significant technical hurdle. Overcoming this resistance would require substantial buying volume and conviction to re-establish a clear upward trajectory. Failure to break above it could lead to consolidation, a period of sideways trading, or even a pullback, as investors who bought at higher prices or who adhere to technical signals might use this resistance point to take profits or initiate short positions. This divergence between the psychological optimism of nearing an all-time high and the technical reality of being below a critical resistance point creates a complex landscape for investors.
Ultimately, the Nasdaq 100’s current position presents a compelling case study in market dynamics, highlighting the interplay between fundamental drivers and technical indicators. While the allure of breaking new historical highs is undeniable and reflective of genuine strength in key technology sectors, the lingering presence of a broken trendline serves as a crucial reminder to maintain a balanced perspective. For young adults navigating the complexities of financial markets, this scenario underscores the importance of looking beyond simple price movements. Understanding technical concepts like trendlines can provide valuable context, revealing potential areas of resistance or support that might not be immediately obvious from headline figures alone. The coming weeks will be critical: a decisive break above both the all-time high and the technical resistance level would signal a re-establishment of a robust uptrend. Conversely, a rejection from this trendline could lead to further price consolidation or a re-evaluation of market enthusiasm. Investors are keenly watching to see whether the bullish momentum can overcome this technical barrier and usher in a new chapter of growth for the technology giants that define the Nasdaq 100.


